stats IN MARK KEPPEL
self esteem for everyone.

Mr. Gualcherani has a jar. To most students, it's just an empty jar of air. But to Mr.Gualcherani, they serve as self-esteem points meant to motivate us to try, to work, and to do our best. It's there to remind us to constantly participate, because if we do participate, and get it right, we can get awarded with 100000000 self-esteem points. And what's better than that? As lame as the jar is, I'm glad Mr. Gualcherani invented it. It's a good idea- better than just simply raising our hands and answering questions.
Yes, we have worksheets. We have textbooks. We have homework. It's not the funnest class... or the most relevant (What's the probability that I'm going to be infected with Disease A if Disease A......?).. BUT there was one project we had that I appreciated it (And would appreciate it more if I was still picking class...)
For all the AP classes at our school,
1. We passed out a survey that provided answers to questions like "How hard is it to get an A/B/C in this class?" and "How many hours do you spent on the weekend for this class".
2. Teachers had students fill out the form anonymously.
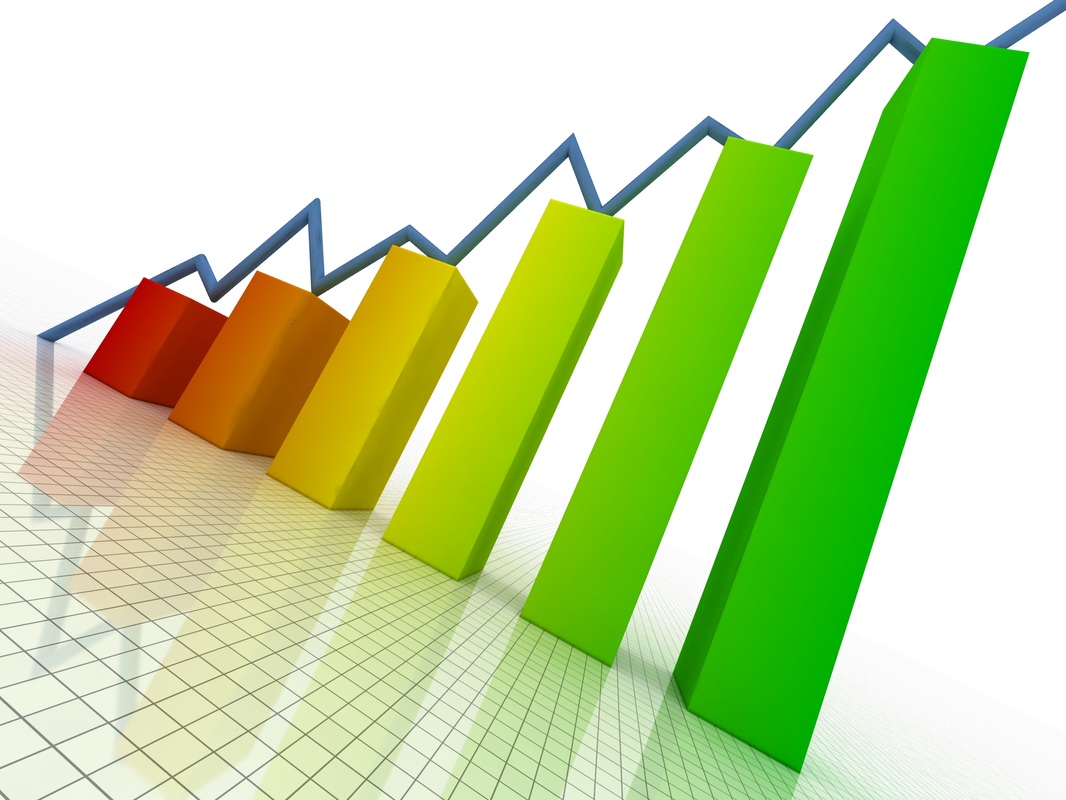
3. After collecting the surveys, we summarized the data by putting the into different graphs - Bar, Pie, & Rose.
These graphs, when taught how to interpret it, would give students who are interested in taking the class an answer to "How hard is this class?" - which becomes very useful when choosing class.
Almost everyone believes math is useless, and Statistics isn't an exception. However, this assignment was actually relevant to what we do in High School- picking our classes. As High School students picking classes, we tend to favor picking the easier ones, the ones with less work, and these surveys, tells us a brief description of each AP classes.
For all the AP classes at our school,
1. We passed out a survey that provided answers to questions like "How hard is it to get an A/B/C in this class?" and "How many hours do you spent on the weekend for this class".
2. Teachers had students fill out the form anonymously.
3. After collecting the surveys, we summarized the data by putting the into different graphs - Bar, Pie, & Rose.
These graphs, when taught how to interpret it, would give students who are interested in taking the class an answer to "How hard is this class?" - which becomes very useful when choosing class.
Almost everyone believes math is useless, and Statistics isn't an exception. However, this assignment was actually relevant to what we do in High School- picking our classes. As High School students picking classes, we tend to favor picking the easier ones, the ones with less work, and these surveys, tells us a brief description of each AP classes.
